


Economic order quantity is the order size that costs you the least overall. It balances the cost of placing orders against the cost of holding what you ordered, and it has a single formula.
This guide covers what EOQ is, the formula, a worked example and a calculator for your own numbers. It also covers where the holding cost figure actually comes from. That last part is where most EOQ calculations go wrong.
What Is Economic Order Quantity?
EOQ is the order quantity that minimizes your total inventory cost. Order too much and you pay to store it; order too little and you pay to reorder constantly.
Two costs pull in opposite directions. Ordering cost is what each purchase order costs you to raise and receive, regardless of size. Holding cost is what it costs to keep one unit in stock for a year.
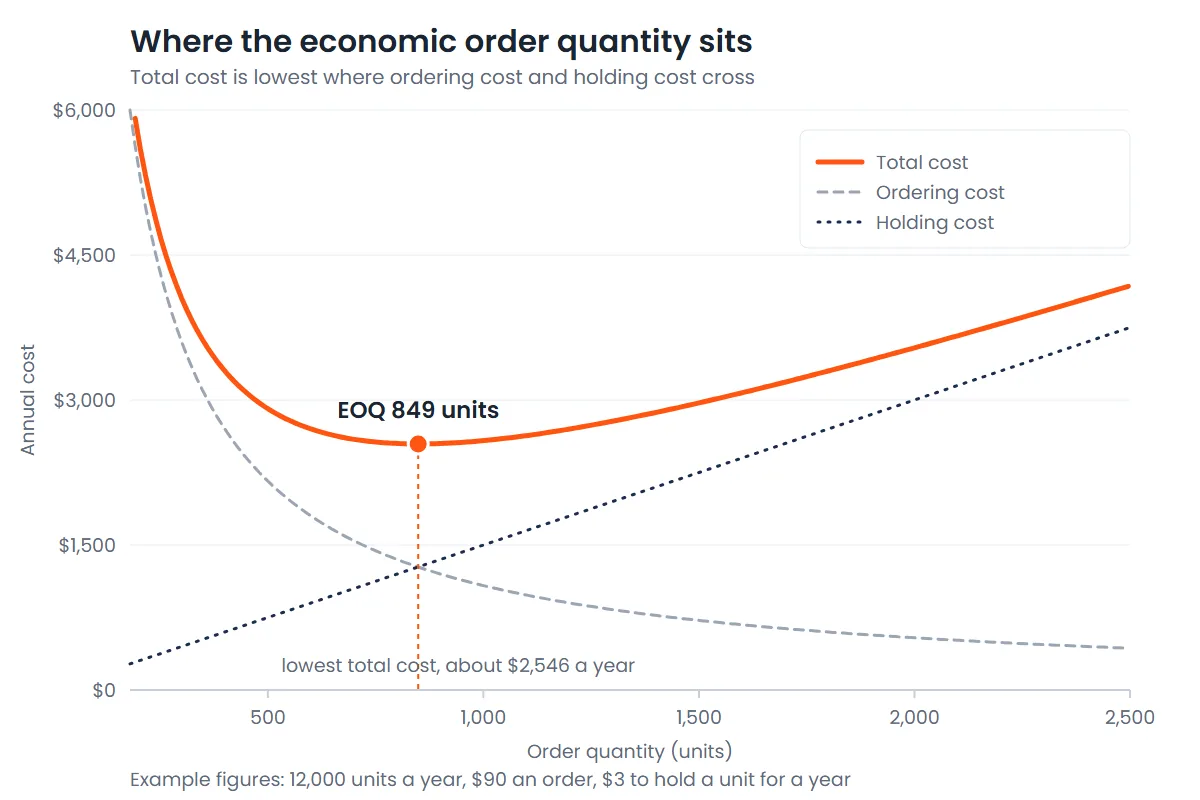
EOQ is the point where those two curves cross. It is a starting number for a conversation with your supplier, not a rule you have to obey.
The EOQ Formula
The formula is the square root of two times annual demand times order cost, divided by holding cost per unit per year.
EOQ = √(2DS / H)
- D — annual demand in units.
- S — cost to place one order, in currency.
- H — cost to hold one unit for one year, in currency.
All three inputs have to cover the same period. If D is annual, H must be annual too, or the answer is meaningless.
A Worked Example
On 12,000 units a year the answer is about 849 units an order. Here is the arithmetic behind it, on example figures.
Say you sell 12,000 units a year. Each purchase order costs $90 to raise, receive and check. Holding one unit for a year costs $3.
Two times 12,000 times 90 is 2,160,000. Divide by 3 and you get 720,000. The square root of 720,000 is about 849.
That is about 14 orders a year. The figures are illustrative, not Cura rates.
Calculate Your Own EOQ
Enter your three inputs below. The calculator returns the order quantity, how many orders that means per year, and the total annual cost at that quantity.
EOQ calculator
Enter your own figures. Nothing is sent anywhere — the calculation runs in your browser.
The number it gives you is a planning figure. Supplier case sizes, pallet quantities and minimum order quantities will all push the real order size away from it.
Where the Holding Cost Number Comes From
Holding cost is the input people guess at. Guessing is why EOQ answers vary so wildly, because it is not one number but four costs added together.
Capital cost. Money tied up in stock is money you cannot use elsewhere, so this is usually your cost of borrowing.
The Federal Reserve's H.15 release of 28 October 2026 put the bank prime loan rate at 7.00% as of 27 October. That is a defensible starting point if you borrow at or near prime.
Storage cost. What the space costs. In a third-party warehouse this is billed on what you occupy, by pallet position, square foot or cubic foot.
It converts to a per-unit figure cleanly once you know how many units fit in a position. Our guide to pallet storage cost sets out the four pricing models.
Service cost. Insurance, stock counts and the handling that goes with holding goods rather than moving them.
Risk cost. Shrinkage, damage, obsolescence and markdowns. Our guide to inventory shrinkage covers how to measure the first of those.
Add those four and divide by average inventory value. That gives you a holding cost rate built from your own numbers, not one copied off another website.
What EOQ Assumes, and When It Breaks
EOQ assumes a tidy world, and your world is not tidy. The model takes four things as fixed.
- Demand is steady and known. It assumes you sell at the same rate all year.
- Lead time is constant. Replenishment always takes the same number of days.
- The unit price does not change with volume. No bulk discounts.
- There are no stockouts. Stock arrives exactly as the last unit sells.
Break any one and the answer moves. Seasonal products break the first. Imports break the second, and most supplier agreements break the third.
That does not make EOQ useless. It makes it a baseline you adjust, which is how most planners actually use it.
EOQ vs MOQ
EOQ is what you want to order; MOQ is what your supplier will let you order. They answer different questions and they often disagree.
Economic order quantity is calculated from your costs. Minimum order quantity is set by the supplier, usually because of production runs or shipping economics.
When the MOQ is higher than your EOQ, you either accept the extra holding cost or negotiate. When it is lower, the EOQ stands and the MOQ never binds.
The Types of EOQ Model
Three variations cover most real situations, and each relaxes one of the assumptions above.
- Classic EOQ. The formula as written, with all four assumptions intact.
- EOQ with quantity discounts. Recalculates at each price break, then compares total cost at each one rather than taking the lowest EOQ.
- Economic production quantity. For goods you make rather than buy, where stock arrives gradually as it is produced instead of all at once.
A fourth variation, the backorder model, allows planned stockouts where customers will wait. It is common in made-to-order businesses and rare in retail.
How EOQ Is Used in Practice
Planners use it as a sense check, not an instruction. It tells you whether your current order size is roughly right or badly wrong.
It is one calculation inside a wider discipline. Our guide to warehouse management sets out the processes and systems that reorder decisions sit inside.
The usual method is to run it on your highest-value items first, because that is where a bad order size costs the most. Our guide to ABC analysis covers how to decide which items those are.
The two pair naturally: ABC tells you which items deserve attention, EOQ tells you how much of one to order.
Then you adjust for the things the formula ignores, which is where case sizes, pallet quantities and supplier terms come back in.
Where Cura Resource Group Fits
An EOQ calculation is only as good as the stock position behind it. Cura Resource Group holds the inventory and keeps the count accurate, so the demand figure you put into the formula reflects what actually moved.
You see the stock position as it moves rather than waiting on a count. Our demand planning and forecasting page covers the forecasting side of the same job.
Storage is quoted to your profile rather than read off a list, and a minimum applies. Get a quote with your SKU count and annual volumes, and tell us how you reorder today. We come back within 24 to 48 business hours.
Sources and Further Reading
- Board of Governors of the Federal Reserve System, H.15 Selected Interest Rates — release of 28 October 2026, reporting a bank prime loan rate of 7.00% as of 27 October. Used here for the capital-cost component of holding cost.
Frequently Asked Questions
What is economic order quantity?
Economic order quantity is the order size that gives you the lowest total inventory cost. It balances what it costs to place an order against what it costs to hold stock.
The answer is the point where those two costs are cheapest combined. It is a planning baseline rather than a fixed rule.
What is the EOQ formula?
EOQ equals the square root of 2DS/H. That is two times annual demand times ordering cost, divided by holding cost per unit per year.
D is annual demand in units and S is the cost of placing one order. H is the cost of holding one unit for a year. All three must cover the same period.
How do you calculate EOQ?
Multiply annual demand by the cost per order, double it, divide by the annual holding cost per unit, then take the square root.
On 12,000 units a year, $90 per order and $3 to hold a unit, that is 2,160,000 divided by 3, or 720,000. The square root of that is about 849 units.
What is the difference between EOQ and MOQ?
EOQ is calculated from your own costs and tells you what you would like to order. MOQ is set by your supplier and tells you the least they will sell at once.
When a supplier's minimum sits above your EOQ you either absorb the extra holding cost or negotiate the minimum down.
What are the assumptions of the EOQ model?
Four: demand is steady and known, lead time never changes, the unit price is the same at any volume, and stock never runs out.
Seasonal demand breaks the first, imported goods break the second, and bulk discounts break the third. Most planners treat the result as a baseline to adjust.
What are the types of EOQ model?
The classic model, the quantity discount model and the economic production quantity model cover most cases. The discount version recalculates at each price break and compares total cost. The production version applies when you manufacture rather than buy, so stock builds gradually instead of arriving in one delivery.
What holding cost percentage should I use?
Build it rather than borrow it. Holding cost is capital cost, storage, service and risk added together. Only the first has an obvious market reference, which is your cost of borrowing. A figure copied from another website describes someone else's warehouse, interest rate and shrinkage, not yours.