


Warehouse KPIs are the measurable indicators that show how well a warehouse receives, stores, picks, packs, and ships inventory. The core set spans receiving, put-away, storage, picking, shipping, and safety, and each one is a number you can calculate, benchmark against the industry, and hold a team or a provider accountable to. The common failure is tracking too many of them and acting on none. The U.S. Bureau of Labor Statistics recorded 4.8 recordable injury and illness cases per 100 full-time warehousing and storage workers in 2024, which is why safety belongs in the same scorecard as throughput rather than in a separate report nobody reads.
This guide covers 22 warehouse KPIs with the formula for each, the benchmark that counts as good performance, and the handful worth writing into a contract if a third party runs your warehouse. It is written for operations managers and supply chain leads who already have data and need to know which numbers actually matter.
What Are Warehouse KPIs?
Warehouse KPIs are quantified measures of warehouse performance, tracked over time and compared against a target. A metric becomes a KPI when someone owns it, reviews it on a set cadence, and changes something when it moves the wrong way. Everything else is just reporting.
The distinction matters in practice. Warehouse metrics describe what happened — 4,200 lines picked yesterday. Warehouse key performance indicators tell you whether that was good — 4,200 lines against a 4,000 target, at 99.4% accuracy, with two hours of unplanned overtime. The second version supports a decision.
Good warehouse performance indicators share three traits. They are calculated the same way every period, they have a defined target rather than a vague direction, and they connect to a cost or a customer outcome. A number that fails any of those three will be tracked for a quarter and then quietly abandoned.
What Are the Categories of Warehouse KPIs?
Warehouse KPIs fall into five categories, following the order freight moves through the building: receiving and put-away, inventory and storage, picking and packing, shipping and delivery, and labor and safety. Tracking at least one KPI from every category prevents the classic failure of optimizing one stage while quietly breaking the next.
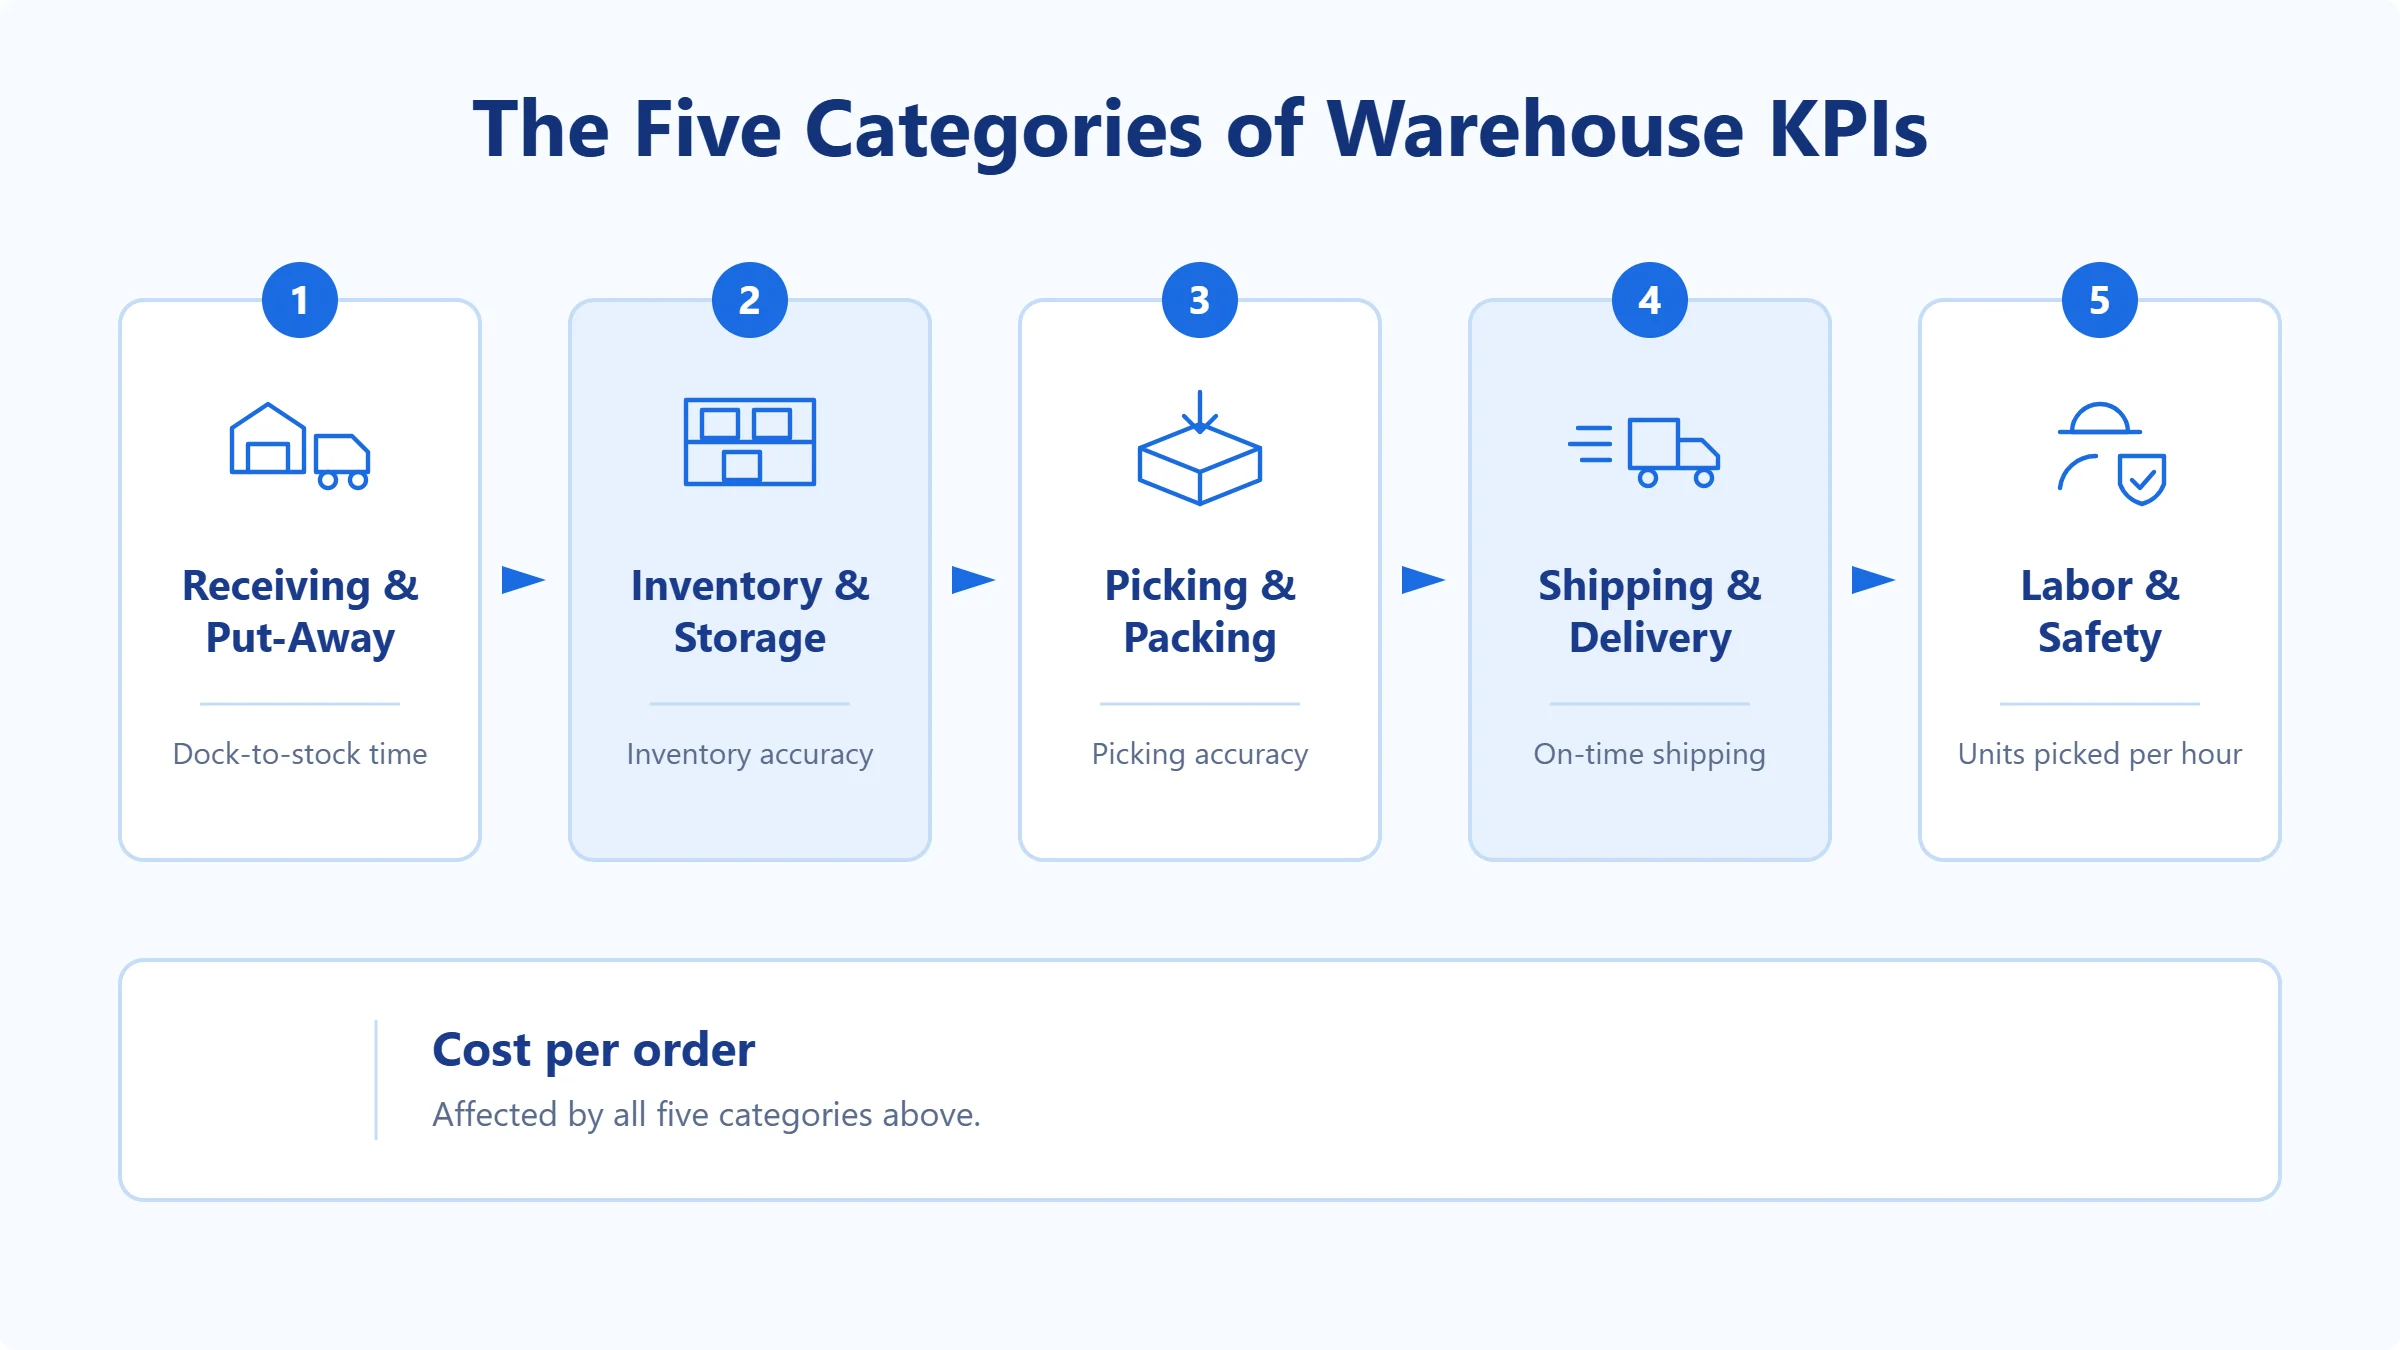
- Receiving and put-away — how quickly and accurately inbound freight enters the building and becomes sellable stock
- Inventory and storage — how well space is used and how closely records match what is physically on the shelf
- Picking and packing — the accuracy and cost of assembling orders
- Shipping and delivery — whether orders leave on time, complete and undamaged
- Labor and safety — productivity, equipment availability and incident rates, which drive both cost and legal exposure
Receiving and Put-Away KPIs
Four KPIs cover the inbound stage: receiving efficiency, receiving accuracy, dock-to-stock time, and put-away accuracy. Together they show how fast and how correctly stock enters the building.
Receiving Efficiency
Receiving efficiency is the volume of inventory received per labor hour. It exposes whether inbound freight is being unloaded at a reasonable cost, and it is the first number to check when receiving costs rise without volume rising.
Formula: Volume received ÷ number of staff hours worked
Receiving Accuracy
Receiving accuracy is the share of inbound shipments logged correctly against the purchase order. Errors here propagate through every downstream stage, so a receiving accuracy problem usually shows up first as a picking problem.
Formula: (Correctly received shipments ÷ total shipments) × 100. Target: 98%+
Dock-to-Stock Time
Dock-to-stock time is how long inventory takes to move from arrival to being available in the system. Slow put-away creates phantom stockouts — the stock is in the building but not sellable, so orders reject against inventory you physically own.
Formula: Total time from receipt to put-away completion ÷ number of receipts. Target: under 24 hours as a contract standard, with same-shift put-away achievable in high-velocity operations
Put-Away Accuracy
Put-away accuracy is the percentage of items placed in their correct location. A misplaced pallet is functionally lost inventory until someone stumbles across it, and it is one of the quiet contributors to inventory shrinkage.
Formula: (Correctly placed items ÷ total items placed) × 100. Target: 99%+
Inventory and Storage KPIs
Six KPIs cover what the warehouse holds: inventory accuracy, replenishment cycle time, inventory turnover, carrying cost, space utilization, and shrinkage rate. They answer whether your records match reality and what the stock is costing you.
Inventory Accuracy
Inventory accuracy compares system records against a physical count, and it is the single most important warehouse KPI because every other number depends on it being right. If inventory accuracy is poor, your picking and shipping metrics are measuring the wrong thing.
Formula: (Counted items matching system record ÷ total items counted) × 100. Target: agree 97%+ with your provider, with 99%+ as a stretch goal
Accuracy is maintained through a counting program rather than an annual scramble, and prioritizing which SKUs get counted most often is where ABC analysis earns its keep. Counts that keep drifting no matter how often you run them point at the day-to-day inventory control underneath — who is allowed to move stock, and whether every movement gets recorded.
Replenishment Cycle Time
Replenishment cycle time is how long it takes to move stock from reserve storage to a forward pick location once the pick face calls for it. A pick face that runs dry stops picking even though the building is full of stock, which is why this belongs next to inventory accuracy rather than buried in a storage report.
Formula: Total time from replenishment trigger to stock available at the pick face ÷ number of replenishments. Target: set from your own baseline, sized so the pick face never runs dry mid-shift
Inventory Turnover
Inventory turnover is how many times inventory sells through and is replaced in a period. Low turnover signals cash tied up in stock that is not moving; very high turnover can signal you are running too lean and risking stockouts.
Formula: Cost of goods sold ÷ average inventory value
The U.S. Census Bureau publishes monthly inventories-to-sales ratios by sector in its Manufacturing and Trade Inventories and Sales series, which is the closest external reference point for judging whether your turnover is reasonable for your category.
Carrying Cost of Inventory
Carrying cost of inventory is the total cost of holding stock — storage, capital, insurance, obsolescence, shrink — as a percentage of inventory value. It is the number that turns “we have plenty of stock” into a cost conversation.
Formula: (Total carrying costs ÷ total inventory value) × 100. Working range: 15–30% annually, depending on category
Warehouse Space Utilization
Warehouse space utilization is the proportion of usable space actually holding inventory. Under 70% suggests you are paying rent on air; consistently over 90% means picking slows down because there is no room to work.
Formula: (Storage space used ÷ total usable storage space) × 100. Target: 80–85%
Inventory Shrinkage Rate
Inventory shrinkage rate is stock lost to damage, theft, miscounting, or administrative error, as a share of total inventory. Small percentages hide large numbers — 1% of a $4M inventory is $40,000 a year.
Formula: ((Recorded inventory − actual inventory) ÷ recorded inventory) × 100. Target: under 1%
Picking and Packing KPIs
Four KPIs cover order assembly: picking accuracy, picking productivity, cost per order, and order cycle time. Speed and accuracy pull against each other here, so read them as a pair.
Picking Accuracy
Picking accuracy is the percentage of orders picked without error. This is the KPI your customers feel directly, because a mispick becomes a return, a replacement shipment, and often a lost customer.
Formula: ((Total orders − incorrect item returns) ÷ total orders) × 100. Target: 99.5%+
Picking Productivity
Picking productivity is units or lines picked per labor hour. Picking absorbs the largest share of warehouse labor hours in the operations we run, so this number drives cost per order more than any other.
Formula: Units picked ÷ total picking hours. Target: the Association for Supply Chain Management puts an average picker at 120 to 175 pieces or cases per hour, with best-in-class above 250
The biggest lever here is travel distance rather than picker speed — which is why slotting and picking method matter more than pushing people to move faster. The mechanics are covered in our guide to the order fulfillment process.
Cost Per Order
Cost per order is total fulfillment cost divided by orders shipped. It is the number to watch when volume grows, because rising cost per order at rising volume means the operation is not scaling.
Formula: Total warehouse operating cost ÷ number of orders shipped
Order Cycle Time
Order cycle time is the average elapsed time from order received to order shipped. Distinct from delivery time, which includes the carrier — this measures only the part you control.
Formula: Total time from order receipt to dispatch ÷ number of orders
Shipping and Delivery KPIs
Five KPIs cover what leaves the building: on-time shipping rate, on-time in full, perfect order rate, order fill rate, and rate of return. These are the numbers your customer actually feels.
On-Time Shipping Rate
On-time shipping rate is the share of orders dispatched within the promised window. This is the metric most often written into service agreements, because it maps directly to a customer promise.
Formula: (Orders shipped on time ÷ total orders shipped) × 100. Target: 95%+
On-Time In Full (OTIF)
On-time in full, usually shortened to OTIF, is the share of orders that arrive both complete and by the promised date, with the two conditions counted together rather than separately. It is stricter than on-time shipping, which ignores whether the order was complete, and looser than perfect order rate, which also requires undamaged goods and correct paperwork. Retailers increasingly write OTIF into supplier agreements with financial penalties attached, so it is worth knowing which definition your customer is using.
Formula: (Orders delivered complete and on time ÷ total orders) × 100. Target: the Association for Supply Chain Management puts typical OTIF at 98% or better
Perfect Order Rate
Perfect order rate is the percentage of orders delivered complete, on time, undamaged, and correctly documented. It is the hardest KPI to hit because it compounds — four stages at 98% each produce a perfect order rate around 92%.
Formula: (Orders delivered complete, on time, damage-free, correctly invoiced ÷ total orders) × 100. Target: 95%+
Order Fill Rate
Order fill rate is the proportion of demand satisfied from stock on hand without backorder. A falling fill rate at stable inventory usually points at forecasting or slotting, not at stock levels.
Formula: (Orders shipped complete ÷ total orders) × 100. Target: 98%+
Rate of Return
Rate of return is the share of shipped orders sent back, ideally split by cause. Splitting matters: returns caused by warehouse error are yours to fix, returns caused by customer preference are a merchandising question.
Formula: (Returned orders ÷ total orders shipped) × 100
Labor and Safety KPIs
Three KPIs cover people and equipment: labor productivity, equipment downtime, and recordable incident rate. They explain much of the movement in every other category.
Warehouse Labor Productivity
Warehouse labor productivity is output per labor hour across the whole operation rather than a single stage. It is the number with the most money behind it, because labor is the largest line in most warehouse operating budgets.
Formula: Total units handled ÷ total labor hours
Equipment Downtime
Equipment downtime is the hours that forklifts, conveyors, or automation are unavailable. Downtime shows up as a picking productivity problem long before anyone attributes it to maintenance.
Formula: (Unplanned downtime hours ÷ total scheduled hours) × 100
Recordable Incident Rate
Recordable incident rate is injuries per 100 full-time workers per year, the standard OSHA measure. Beyond the human cost, incident rates drive insurance premiums and inspection exposure — the requirements are covered in our OSHA warehouse compliance guide.
Formula: (Number of recordable incidents × 200,000) ÷ total hours worked
Target: 4.8 or lower — the U.S. Bureau of Labor Statistics recorded 4.8 total recordable cases per 100 full-time workers across warehousing and storage in 2024, which is the industry figure to measure your own rate against. The Bureau counts a case as work-related when an event or exposure at work “caused or contributed to the resulting condition or significantly aggravated a pre-existing condition,” which is why near-misses and off-site injuries fall outside the number.
How Do You Measure Warehouse Efficiency?
Warehouse efficiency is measured by dividing output by the resource it consumed — units handled per labor hour, orders shipped per hour, or total operating cost per order. Calculate it the same way every period, and always read it next to an accuracy figure, because efficiency bought by skipping checks comes back later as returns and rework.
Four measures cover most of it. Throughput is units or orders processed ÷ time period — a measure of capacity rather than efficiency, and the one that tells you whether the building can absorb peak volume at all. Labor efficiency is units handled ÷ labor hours. Cost efficiency is total warehouse operating cost ÷ orders shipped. Space efficiency is storage space used ÷ usable storage space, where 80–85% is a sensible target band. A warehouse improving on all four at once is genuinely getting better; one improving on speed alone is usually moving cost somewhere less visible.
What Are Good Warehouse KPI Benchmarks?
Good general-merchandise benchmarks are 97%+ inventory accuracy, 99.5%+ picking accuracy, 95%+ on-time shipping, and under 1% shrinkage. Targets vary by industry, order profile, and automation level, so treat the table below as a starting point rather than a standard.
| KPI | Formula (short) | Target |
|---|---|---|
| Inventory accuracy | Matched counts ÷ counted × 100 | 97% / 99%+ stretch |
| Picking accuracy | (Orders − mispicks) ÷ orders × 100 | 99.5%+ |
| Receiving accuracy | Correct receipts ÷ receipts × 100 | 98%+ |
| Put-away accuracy | Correct placements ÷ placements × 100 | 99%+ |
| Dock-to-stock time | Receipt-to-putaway ÷ receipts | Under 24 hours |
| On-time shipping | On-time ÷ shipped × 100 | 95%+ |
| On-time in full (OTIF) | Complete and on time ÷ total × 100 | 98%+ (ASCM) |
| Order fill rate | Complete ÷ total orders × 100 | 98%+ |
| Perfect order rate | Flawless orders ÷ total × 100 | 95%+ |
| Space utilization | Used ÷ usable × 100 | 80–85% |
| Shrinkage rate | (Recorded − actual) ÷ recorded × 100 | Under 1% |
| Carrying cost | Carrying costs ÷ inventory value × 100 | 15–30% annually |
| Replenishment cycle time | Trigger-to-pick-face ÷ replenishments | Set from your own baseline |
| Receiving efficiency | Volume received ÷ staff hours | Set from your own baseline |
| Inventory turnover | COGS ÷ average inventory value | Set from your own baseline |
| Picking productivity | Units picked ÷ picking hours | 120–175/hour, 250+ best-in-class (ASCM) |
| Cost per order | Operating cost ÷ orders shipped | Set from your own baseline |
| Order cycle time | Receipt-to-dispatch ÷ orders | Set from your own baseline |
| Rate of return | Returned ÷ shipped × 100 | Set from your own baseline, split by cause |
| Labor productivity | Units handled ÷ labor hours | Set from your own baseline |
| Equipment downtime | Unplanned downtime ÷ scheduled hours × 100 | Set from your own baseline |
| Recordable incident rate | (Recordables × 200,000) ÷ hours worked | 4.8 per 100 FTE (BLS industry average, 2024) |
Eight of these twenty-two have no meaningful cross-industry benchmark, and a borrowed number would mislead more than it helps. Turnover depends on product category, cost per order on order profile and packaging, picking productivity on layout and pick method. Set those from your own trailing four quarters, agree a direction of travel rather than an absolute, and revisit the target when volume or product mix changes materially.
Which Warehouse KPIs to Write Into a 3PL Agreement
Four KPIs belong in almost every 3PL agreement: inventory accuracy, on-time shipping, order accuracy, and dock-to-stock time. If a third party runs your warehouse, KPIs stop being a management tool and become contract terms. An agreement without measurable standards is a handshake with an invoice attached — and most disputes trace back to a target that was never defined precisely enough to test.
Four belong in almost every contract:
- Inventory accuracy, with the counting program specified — how often, how many SKUs, and who verifies
- Order accuracy — picking accuracy measured at the order level, with the counting basis defined. Two providers quoting 99.5% can mean genuinely different things depending on whether they count by line, by unit, or by order
- On-time shipping, with the daily cut-off time stated explicitly
- Dock-to-stock time, because slow put-away creates stockouts your customers experience but your inventory report does not show
Agree the measurement method as carefully as the number, set a reporting cadence, and define what happens when a target is missed twice in a row. If you are evaluating providers now, request a quote and ask to see their actual performance data rather than their target sheet.
Cura Resource Group reports against these same metrics for the brands it stores inventory for, which is the point worth pressing with any provider: ask whether the numbers come straight out of the WMS or get assembled by hand at month end. Hand-assembled KPIs tend to flatter whoever assembles them.
How to Build a Warehouse KPI Dashboard
Start with five KPIs, not thirty. One per category, chosen because someone will act on it. A dashboard nobody opens is worse than no dashboard, because it creates the impression of control.
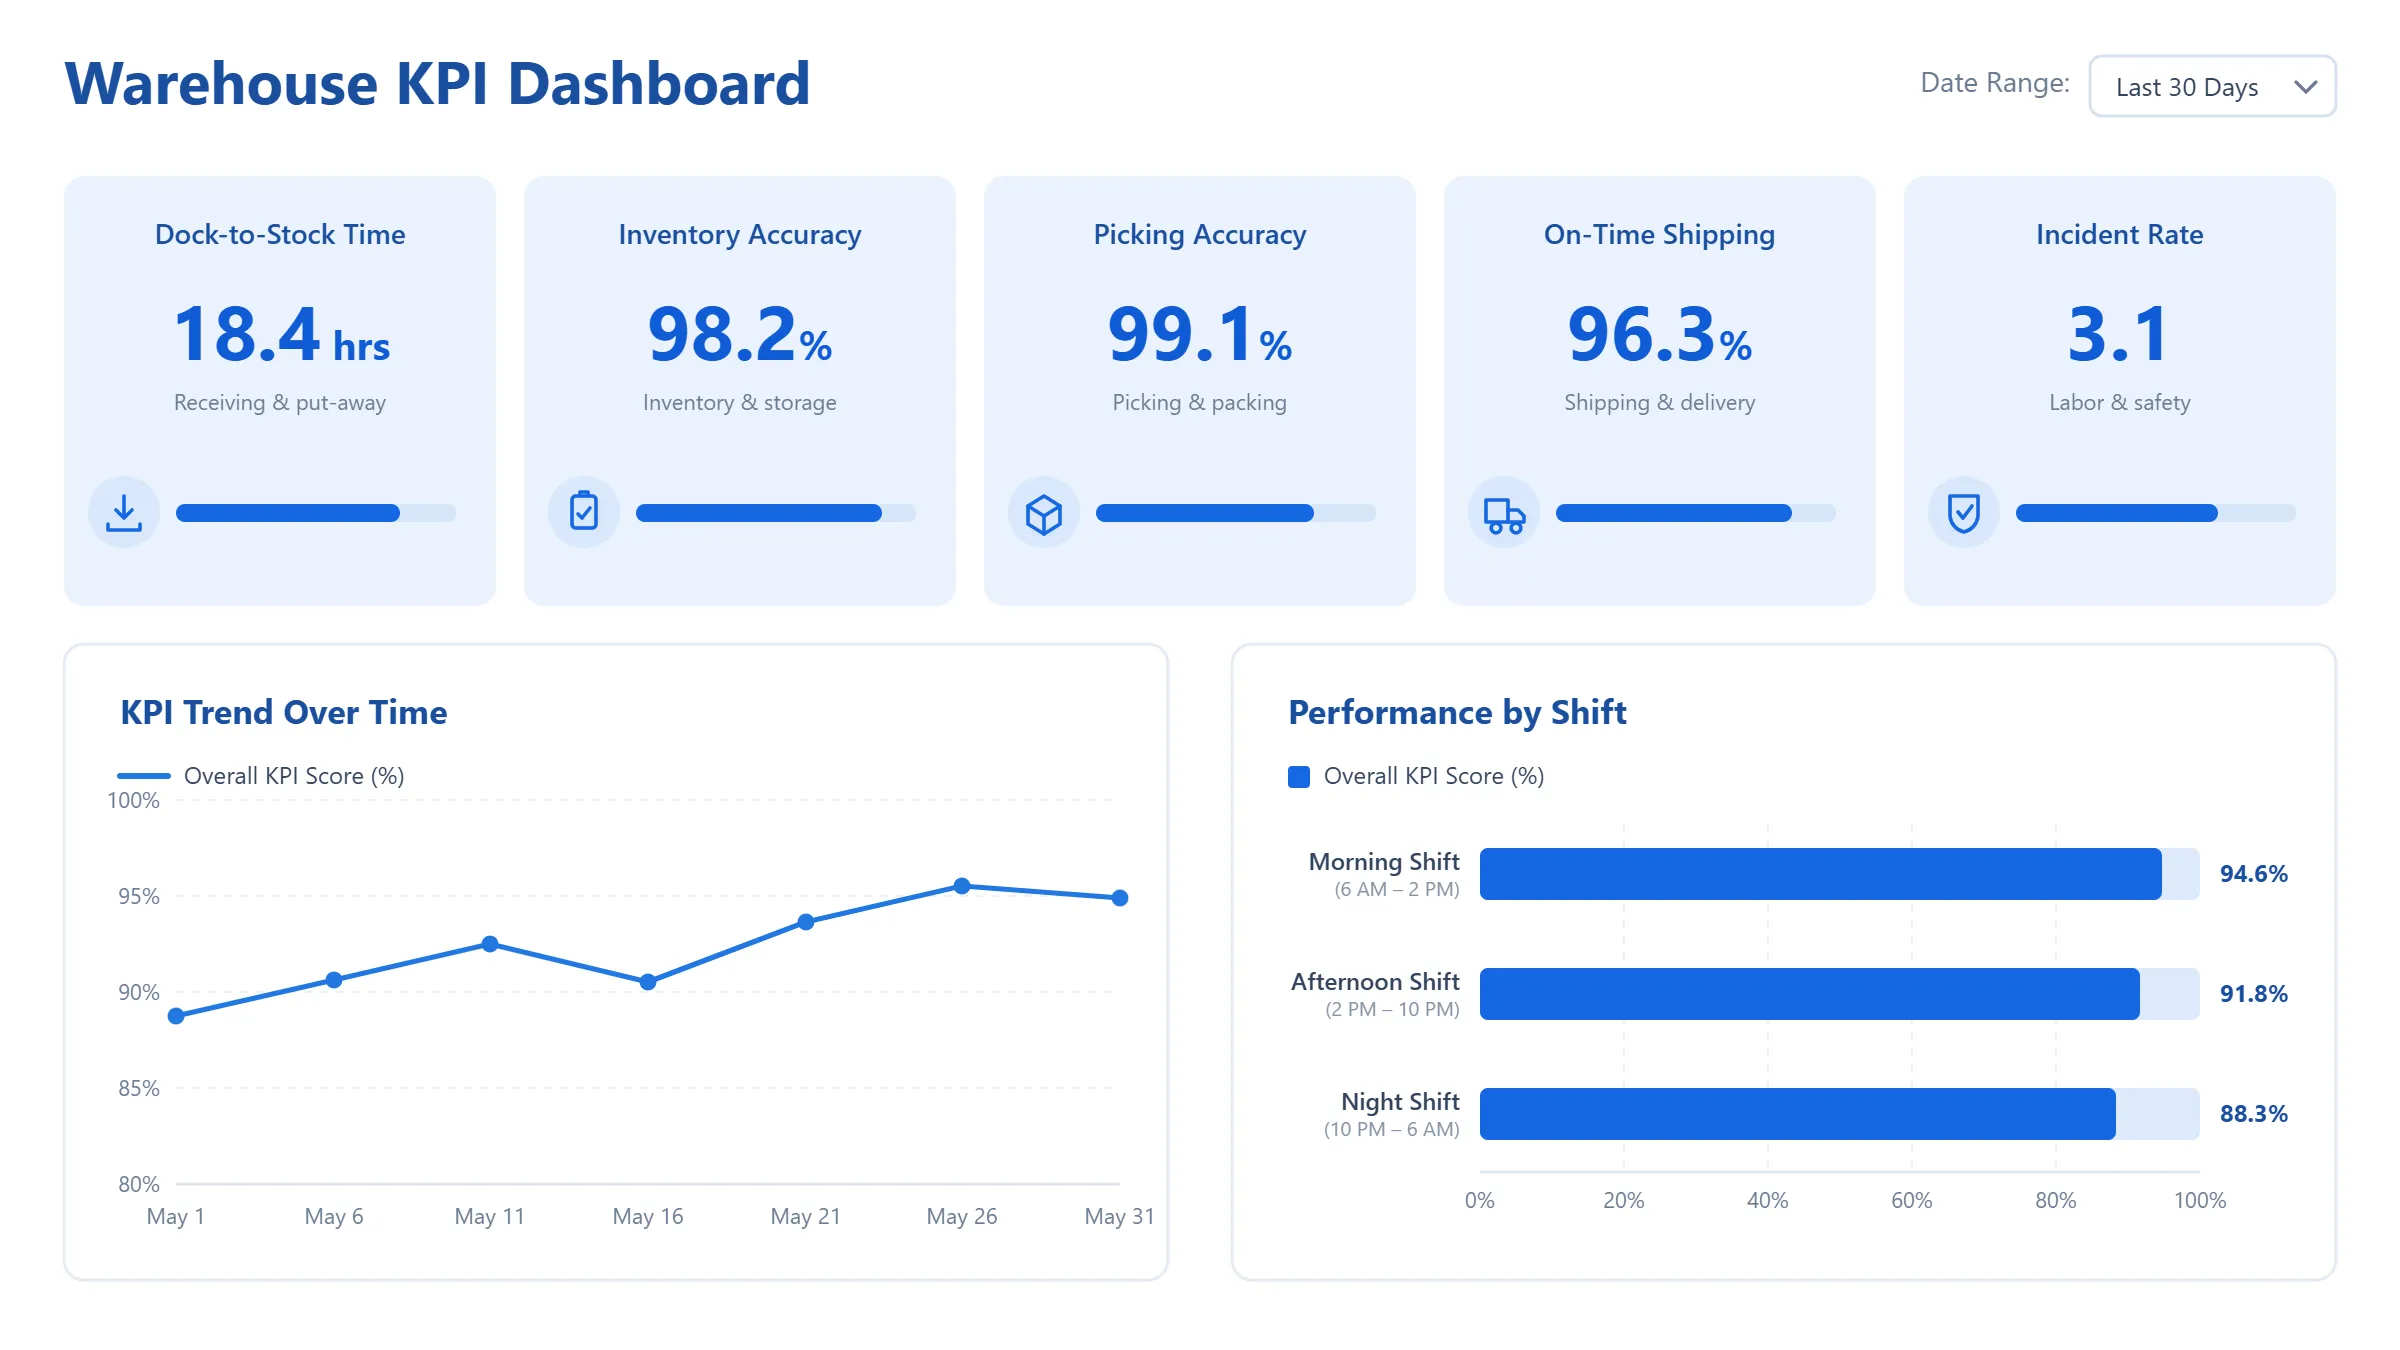
- Pick one KPI per category — receiving and put-away, inventory and storage, picking and packing, shipping and delivery, labor and safety
- Set a target for each, using the benchmark table above as a starting point and adjusting to your order profile
- Define the calculation in writing so the number means the same thing next quarter and to the next person
- Automate collection from your warehouse management system — manually compiled dashboards stop getting maintained
- Review on a fixed cadence, weekly for operational KPIs and monthly for cost KPIs
- Add KPIs only when the current five are consistently on target
How to Improve a Warehouse KPI That Is Off Target
Fix an off-target KPI by tracing it back to the stage that produces it, correcting that stage, then re-measuring. A KPI moving the wrong way is a symptom, not a diagnosis. The fix is almost never “try harder” — it is finding which upstream stage is producing the number. Here is where to look first for the four KPIs that matter most.
If Inventory Accuracy Is Falling
Check put-away accuracy before you check counting. Most accuracy problems are placement problems: stock is in the building, in the wrong location, and therefore invisible. Move from annual counts to a continuous counting program, prioritize the SKUs that move most, and audit the locations with the highest transaction volume rather than a random sample.
If Picking Accuracy Is Falling
Look at travel distance and slotting before blaming pickers. Errors cluster where fast-moving SKUs sit in hard-to-reach locations or where similar-looking items are stored adjacent to each other. Scan verification at the pick face catches errors before they reach packing, which is where a mispick becomes expensive. Separating lookalike SKUs is often the single highest-return change.
If Warehouse Productivity Is Falling
Measure travel time as a share of total picking time. In the manual operations we run, travel is the largest component of pick time, so slotting changes and batch or zone picking beat any attempt to increase individual pace. Where volume justifies it, warehouse automation shifts the ceiling rather than the effort.
If Cost Per Order Is Rising at Stable Volume
Work backwards through the components — labor hours per order, packaging cost per order, and rework from returns. Rising cost at flat volume almost always means one stage is absorbing error from another, most often packing absorbing picking mistakes or customer service absorbing shipping errors.
Common Mistakes When Tracking Warehouse KPIs
The three most common mistakes are tracking many metrics and acting on none, optimizing one stage in isolation, and comparing numbers built from different formulas.
- Tracking thirty metrics and acting on none. Coverage is not the goal; changed behaviour is.
- Optimizing one stage in isolation. Pushing picking speed without watching picking accuracy trades a visible number for an invisible cost.
- Comparing across different formulas. Accuracy measured by line and accuracy measured by order are not the same figure and should never be trended together.
- Ignoring safety until an incident. Incident rate is a leading indicator of cost, not a compliance afterthought.
- Setting targets from a blog post rather than your own baseline. Benchmarks are a starting point; your last four quarters are the real reference.
- Reviewing quarterly. Operational KPIs go stale in weeks — by the time a quarterly review flags a problem, you have lived with it for three months.
Final Word
The warehouses that improve are rarely the ones tracking the most metrics. They pick a small set of warehouse KPIs, define them precisely, review them often enough to act, and hold someone accountable for each. Start with inventory accuracy, picking accuracy, on-time shipping, and cost per order — those four will tell you most of what you need to know, and the rest can wait until they are consistently green.
If a 3PL is running the operation, the same numbers become the terms of the relationship. Ask for them monthly, ask how they are calculated, and compare them against the benchmarks above rather than against the provider’s own targets.
Frequently Asked Questions
What Makes a Warehouse Metric a KPI?
Warehouse KPIs are measurable indicators of warehouse performance across receiving, put-away, storage, picking, shipping, and safety. Each has a defined formula and a target. A metric becomes a KPI only when someone owns it, reviews it regularly, and acts when it moves the wrong way.
What Are the Most Important Warehouse KPIs?
The most important warehouse KPIs are inventory accuracy, picking accuracy, on-time shipping, and cost per order. Inventory accuracy comes first because every other metric depends on the underlying records being correct. Together these four cover data integrity, customer experience, and unit economics, which is enough to run a weekly review against.
What Is a Good Inventory Accuracy Rate?
A reasonable target to agree with a provider is 97% or better, with 99% or above as a stretch goal. Below 95%, downstream metrics stop being trustworthy, because picking and shipping results are being measured against records that do not reflect what is physically in the building.
What Is the Perfect Order Rate?
Perfect order rate is the percentage of orders delivered complete, on time, undamaged, and correctly invoiced. It compounds, so four stages performing at 98% each yield roughly 92% overall. A reasonable target to agree with your provider is 95% or higher, and it is the closest single measure of customer experience.
How Often Should Warehouse KPIs Be Reviewed?
Operational KPIs such as picking accuracy and on-time shipping weekly; cost KPIs such as cost per order and carrying cost monthly. Quarterly review is too slow for operational metrics — a problem spotted at quarter end has usually been running for months.
What Is a Good Warehouse Space Utilization Rate?
A good warehouse space utilization rate is between 80% and 85% of usable space. Below 70% means paying for space that holds nothing. Above 90% typically slows picking and put-away, because congestion removes the working room staff and equipment need to move efficiently, and it leaves no buffer for a peak-season inbound surge.
How Do You Hold a 3PL Accountable to Warehouse KPIs?
Hold a 3PL accountable on four KPIs: inventory accuracy, order accuracy, on-time shipping, and dock-to-stock time, each with the measurement method defined in writing. Specify whether accuracy is counted by line, unit, or order — that single definition is the most common source of performance disputes.
How Do You Calculate Warehouse Efficiency?
Divide output by the resource used: units handled ÷ labor hours, or orders shipped ÷ total operating cost. Calculate it the same way every period and pair it with an accuracy figure, because efficiency gained by cutting checks reappears later as returns and rework.
How Can You Improve Warehouse Productivity?
Reduce travel distance before increasing pace. Slot fast-moving SKUs into accessible forward-pick locations, adopt batch or zone picking as volume grows, and remove the causes of rework. Travel is the largest component of pick time in the operations Cura runs, so layout beats effort, and slotting should be revisited each quarter as velocity shifts.
How Do You Calculate Inventory Carrying Cost?
Add storage, capital, insurance, taxes, obsolescence and shrink, then divide by average inventory value and multiply by 100. Plan on 15% to 30% annually as a working range, then confirm it against your own cost lines. The capital and obsolescence components are the ones most often left out.
What Is Inventory Variance?
Inventory variance is the difference between recorded inventory and what a physical count actually finds, expressed as a count or a percentage. Persistent variance in the same locations points to a process fault — usually put-away or receiving — rather than to theft.